
Table of Contents
What is PERT Chart?
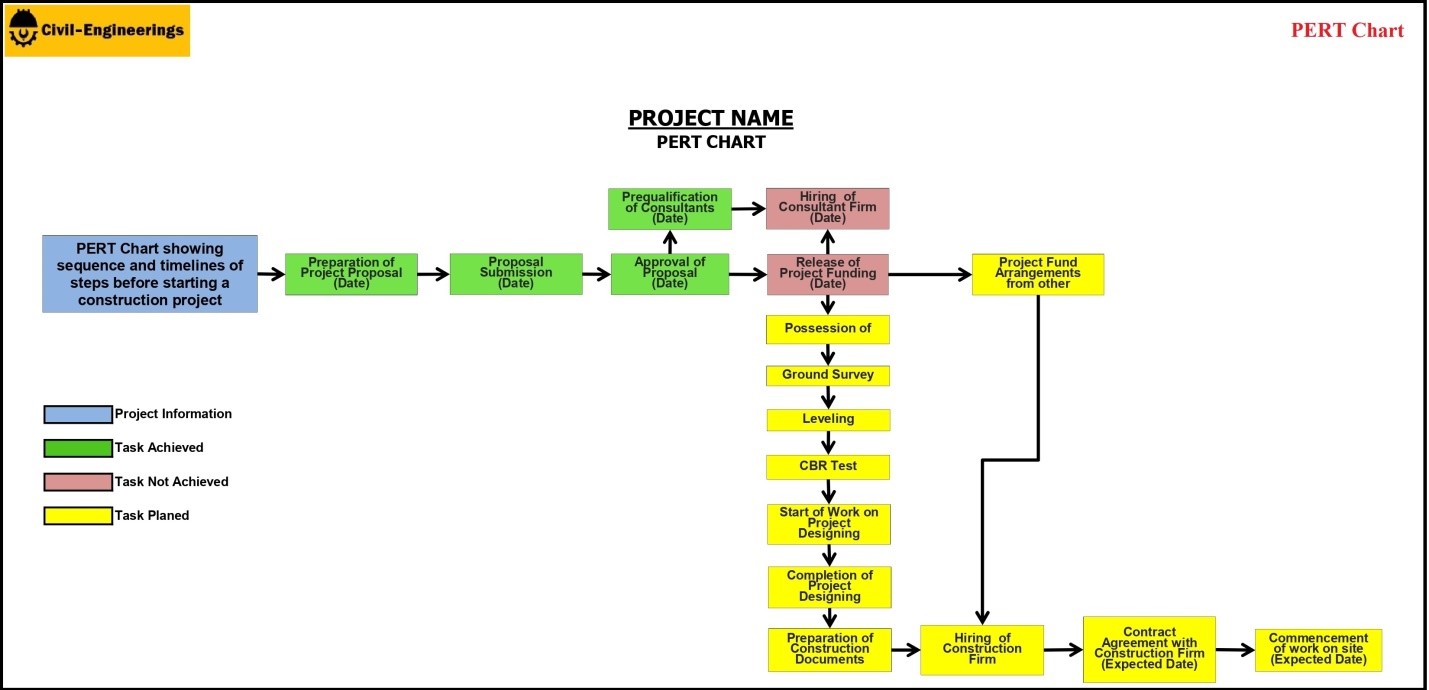
A PERT chart or PERT graph is a professional way to plan, organize and visualize the sequence of tasks within a project. PERT is stand for Program Evaluation & Review Technique and chart is its graphical representation. It is a project management tool that helps to identify the timeline for completing a project by representing the tasks and their dependencies in a flowchart format. This chart also show the minimum time required for project completion.
How to make a Pert Chart
To make a PERT chart, you need to follow these steps:
- Prepare a list of activities or tasks required for project completion.
- Define dependencies or set the sequence of tasks to show which tasks rely on others to begin.
- Estimate the start time and end time for each task.
- Draw a PERT chart in MS Excel using shapes like rectangles, straight arrows and elbow connectors etc.
Components of a PERT Chart
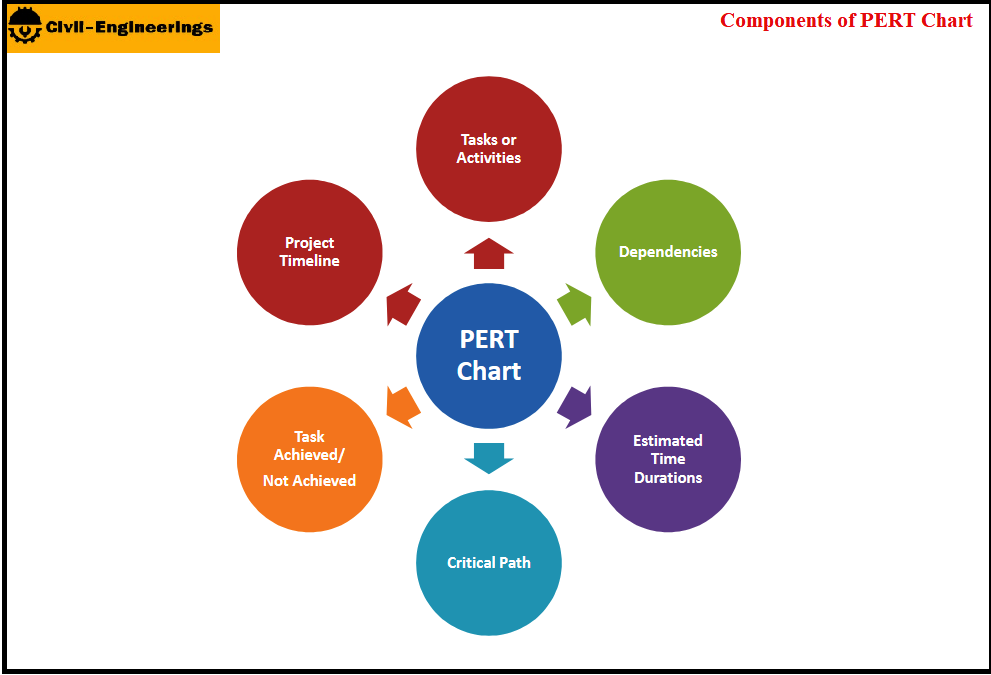
The main components of a PERT chart are as follows:
a) Tasks or Activities
Tasks or activities are represented by nodes (e.g. rectangles, squares or circles) in a PERT chart. These are the essential steps required to complete the project.
b) Dependencies
Arrows connect the nodes, showing the sequence of tasks and indicating which tasks must be completed before others can start.
c) Estimated Time Durations
Each task includes a calculated duration by noting estimated start time and end time.
d) Critical Path
The longest chain of dependent tasks from start to finish, representing the minimum project duration. Tasks on this path are critical to timely project completion.
e) Task Achieved/Not Achieved
Tasks achieved or not achieved are highlighted on a PERT chart using different color, like green for tasks achieved and gray for tasks not achieved.
f) Project Timeline
The PERT chart provides an overall timeline for the project, indicating the flow and duration of tasks necessary for completion.
Purpose of PERT chart
The primary purpose of a PERT chart is to facilitate effective project management by providing a clear visual representation of tasks, their dependencies and timelines. It helps project managers to estimate the overall project duration using expected time estimates. PERT chart also identifies the critical path that is a longest sequence of dependent tasks, which determines the minimum time required for project completion.